Homework 3
Instructions
Your solutions should be in form of a report in .md format. Make sure to document you procedure properly. You will be tasked with exploring and analysing three datasets. Make sure that your answers are clear and that you have documented your procedure.
When you are finished push you results to Github and raise an issue, just as you have done in previous homeworks. To pass the homework you will have to complete the assigments below and also finish the peer-review.
Feel free to contact me if anything is unclear.
Exploratory Data Analysis
IRIS data
In the file IRIS.csv you will find data on three species of iris flowers. The data contains information about the dimensions of aspects of the flower. Your task is to visualise the dataset.
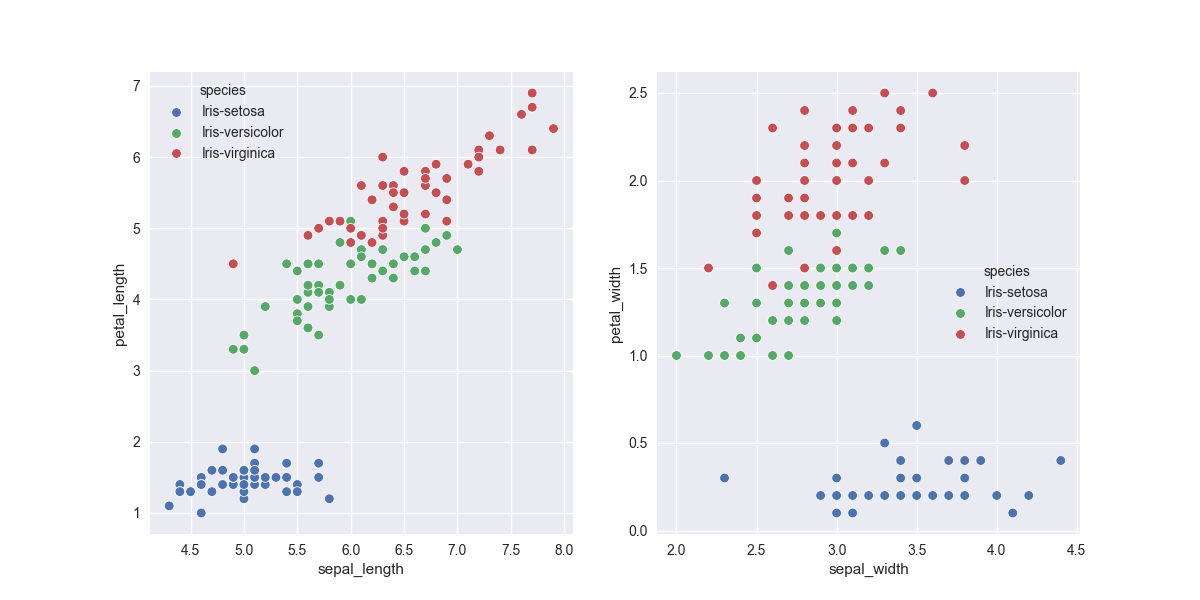
Is there a relationship between sepal dimensions and petal dimensions? Generate the following figure.

What can you say about the relationship given the figure?
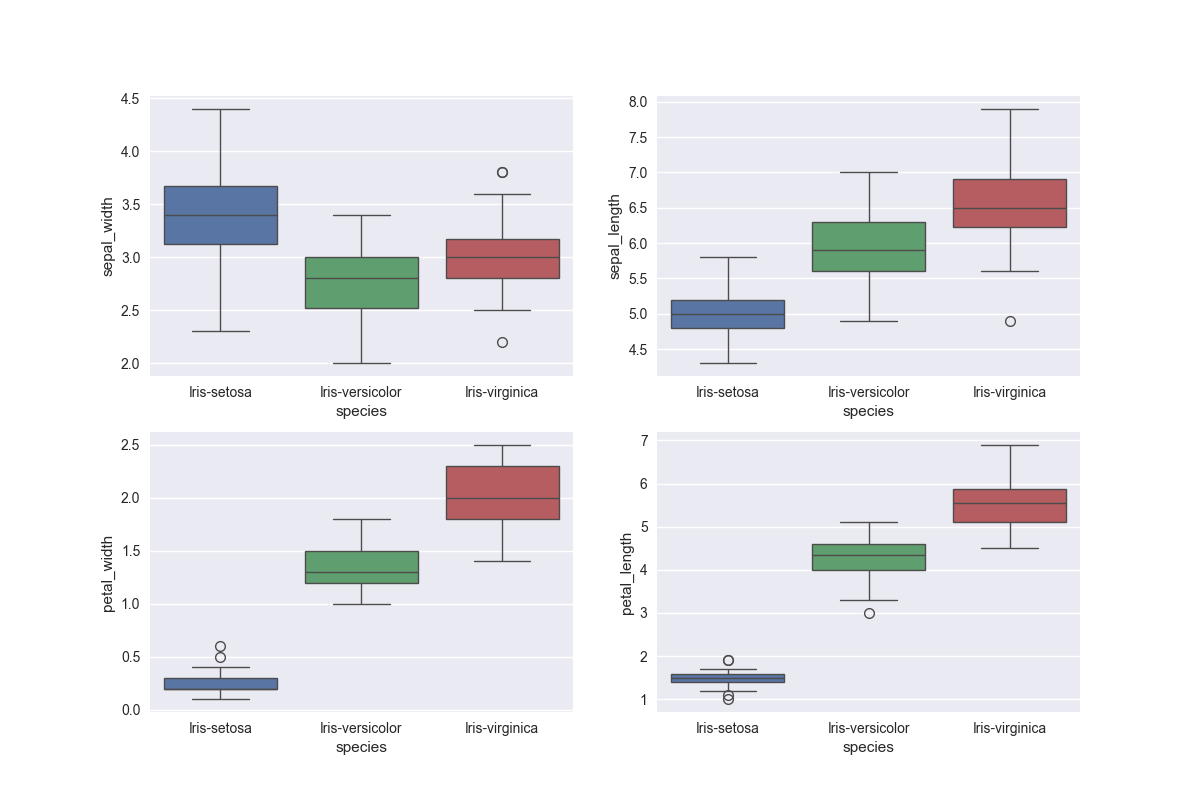
How are the sepal and petal dimensions distributed? Generate the following figure.

What can you conclude from this figure?
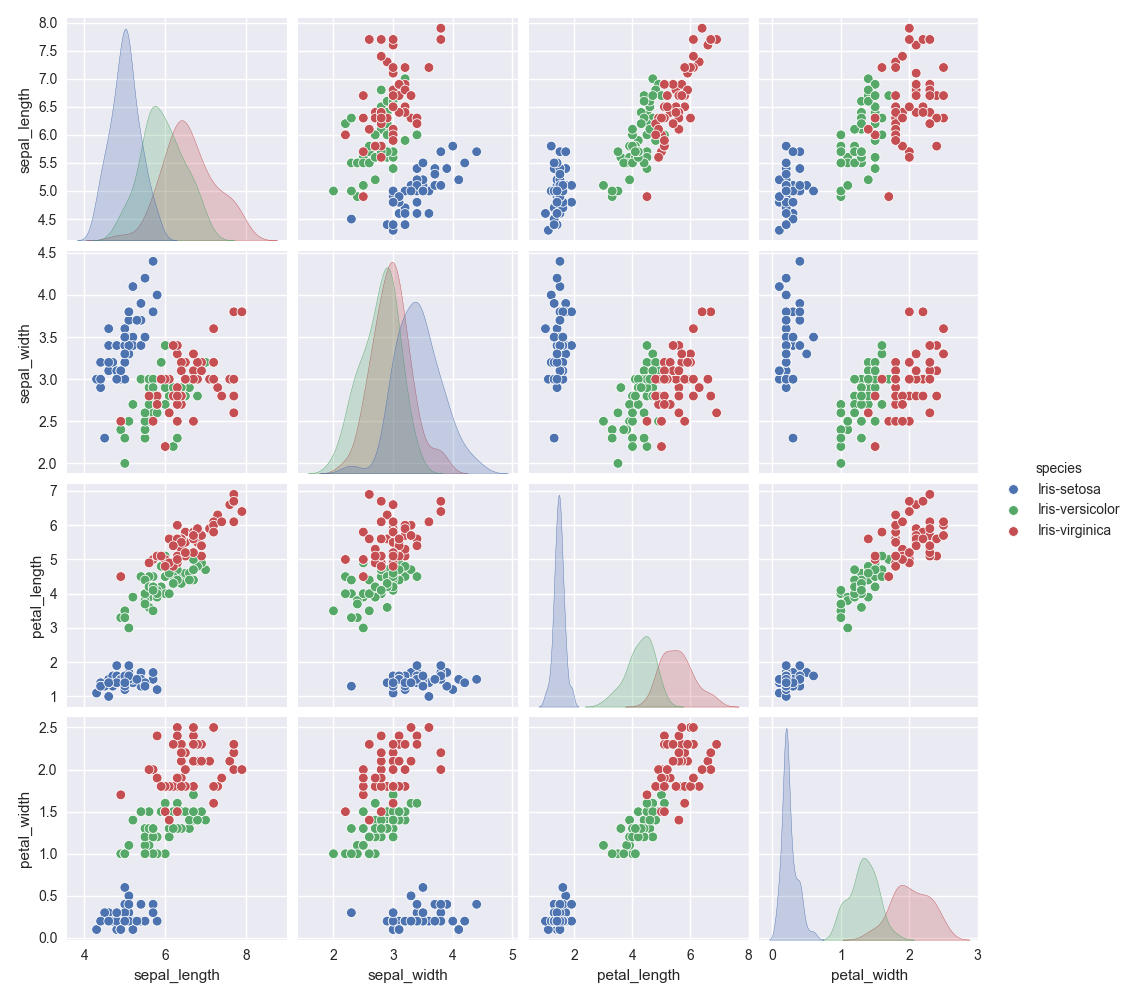
The so called pairs-plot is a very simple way of quickly analysing realtionships between data. Generate the following figure

Briefly, mention how the different variables are related to each other.
Birdwatching
On Artportalen, you can find data on animals, plats and mushrooms. The dataset has been aggregate by both scientist and hobbyists, which is what we call citizen science. In the file artportalen.csv you will find data on bird sightings made in 2022 in the royal national park. Your task is to explore and analyse the dataset.
Begin by familiarising yourself with the dataset.
After you have made yourself familiar with the dataset, answer the following questions.
- What are the most prevelant species?
- What is the monthly distribution of the top 3 most prevelant species
- What are the rarest species?
Now it is time for you to explore the dataset on your own. Generate at least 3 questions on your own and explore the dataset. What does these questions + answers tell you about the data? Make sure the questions highlight something in the dataset and is significant.
Predicting Strokes
In the file stroke-data.csv you can find data about stroke cases and information about the individuals it pertains. find out more about the dataset.
Your task is to explore this dataset on your own. Where does your exploration lead you? What can you say about the dataset? Explain the content of the dataset and generate at least 3 serious questions that give you insight.