Exam MT4007 Jan 8, 2024
READ THE Overview BEFORE BEGINING
Overview
The exam should be handed in just as you have done during the homework. Create a sub-directory in your github repository and name it exam. To complete the exam the code and the final .md file should be uploaded to your repo. Finally, an issue should be raised when you hand in, no later than 21.00. You will automatically fail if you hand in later than that. Make sure that your answers are short and concise.
All the data required for the exam can be found in the data repo under the sub-directory exam_data.
Permitted Tools
You are NOT allowed to collaborate with others.
All the packages taught in the course are permitted. If you use exotic packages you might need to explain the methods you have used orally.
Tools such as Chat-GPT are allowed as long as you understand what has been used. Copy-pasting things that you do not understand is NOT allowed. Be careful using Chat-GPT in the theoretical part, it provides faulty answers on these questions.
If I suspect that you have blatantly copied answers from the internet without understanding, you will have to perform an oral exam.
Help
I will be available on Zoom for questions during the following times:
- 12.30-13.00
- 15.30-16.00
- 17.30-18.00
Besides these times you can reach me via email.
Grading
To pass the exam you need at least 7 points in the theoretical part and 15 points in practical part. Besides that the grading is as follows:
| Grade | F | E | D | C | B | A |
|---|---|---|---|---|---|---|
| Points | 0-21 | 22-26 | 27-31 | 32-35 | 36-39 | 40-45 |
Theoretical Part
1. Functional Programming (5p)
In functional programming, concepts like immutability, pure functions, and higher-order functions play crucial roles. Describe a scenario in a functional language of your choice where the use of a higher-order function enhances the code's readability and maintainability, especially when dealing with immutable data structures. Explain how this scenario benefits from the principles of immutability and pure functions.
2. SQL (5p)
Imagine a database containing a table StudentsGrades with columns StudentID, CourseID, Grade Credits. Write an SQL query to calculate the average grade for each student. Explain the significance of grouping data in SQL and how your query demonstrates this concept. Note that the average grade is a weighted sum of Grade and Credits. For simplicity, you can imagine that the Grade ranges between 1-5 and Credits range between 5-15.
3. RegEx (5p)
Imagine you have access to a log file generated by a backend REST server. Each log entry records an HTTP request and is formatted as follows:
Timestamp [YYYY-MM-DD HH:MM:SS] - RequestType [GET/POST/PUT/PATCH/DELETE] -
ResourcePath - Status [HTTP status code] - ResponseTime [ms]
Timestamp [YYYY-MM-DD HH:MM:SS] - RequestType [GET/POST/PUT/PATCH/DELETE] -
ResourcePath - Status [HTTP status code] - ResponseTime [ms]
For example:
2024-01-05 15:20:30 - GET - /users/1234 - Status 200 - ResponseTime 120ms
2024-01-05 15:20:30 - GET - /users/1234 - Status 200 - ResponseTime 120msYour task is to create a regex pattern that extracts the timestamp, request type, resource path, HTTP status code, and response time from each log entry. Explain your regex pattern in detail, focusing on how it accurately parses each part of the log entry. Additionally, discuss how the regex pattern can accommodate potential variations in the log format, such as different request types or varying lengths of response times.
Practical Part
In this part you will be tested on the practical tools you have learnt in this course. You will be asked to analyse, wrangle and visualise data. Note that the requested figures do NOT have to be exactly match.
If data entry errors(missing-values, duplicates and so on) arise you can remove them from the data unless the question specifically ask for you to deal with them. Make sure to explain what you have done.
4. Monkeypox (10p)
The file monkeypox.csv contains information about the number of monkeypox cases in EU/EEA per day and country. Your task is to:
- List the top 5 countries with highest number of total confirmed cases (ConfCases). Generate the following table. (2p)
| CountryExp | ConfCases |
|---|---|
| Spain | 4942 |
| Germany | 2887 |
| France | 2423 |
| Netherlands | 959 |
| Portugal | 710 |
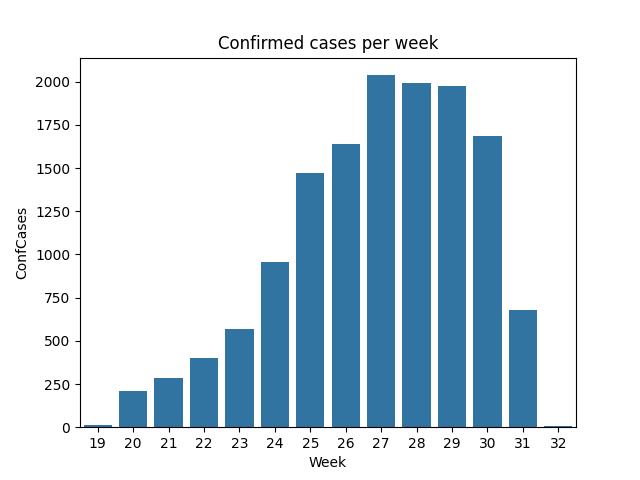
Visualise the total number of cases per week. Recreate the following figure. (2p)

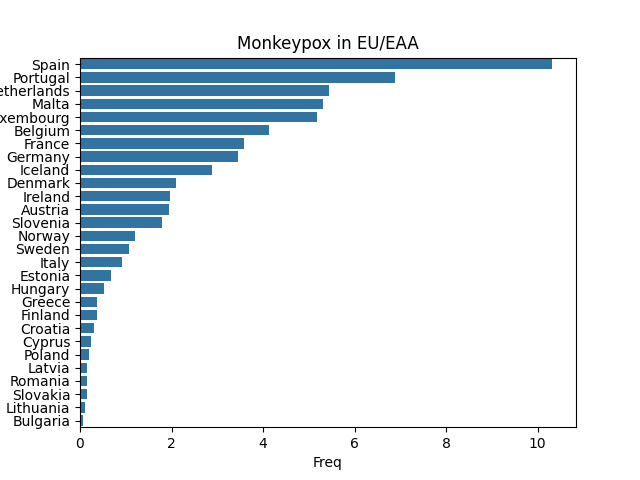
Webscrape the following link for population data. The year 2022 is enough. Visualise the total number of cases per 100 000 inhabitant and per country. That is, generate the following plot. (6p)

5. Data Storage (10p)
In the file studentlog.txt you can find logs of students and the results of courses they are enrolled in. Your task is to parse this log file, create an SQL database and analyse aspects of the dataset.
Read in the file
studentlog.txtusing any method you want and deal with missing entries. Explain your procedure. (4p)Create an SQL query that genenrates a
StudentandCoursetable (2p)Populate the tables with the data from
studentlog.txt(1p)Create a plot that illustrates the most difficult classes. It is up to you to decide what difficult entails. Explain your analysis (3p)
6. Algorithmic Trading (10p)
In the last decade, investing in the stock market using computers has become very popular. This emerging paradigm is called quantitative finance or algorithmic trading. In this task the goal is to analyse an algorithmic trading strategy called the "Moving Average Crossover Difference" or MACD for short. You are applying this strategy to the S&P 500 (which can be seen as a proxy for the US Equity market) and analysing the profitability of the strategy.
The strategy consists of two parameters. A long moving average and a short moving average. The moving average is defined as
That is, the moving average (
We define the Long Moving Average(LMA) as
The idea of the strategy is buy(long) the asset if the difference between the SMA and LMA is positive. And sell(short) the asset if the difference is negative.
- Retrieve data using a
GETrequest to the following adress. (1p)
https://mt4007-ht23.github.io/data/market.jsonhttps://mt4007-ht23.github.io/data/market.jsonThe data should look like the following:
| Date | Price |
|---|---|
| 2023-12-29 | 4769.83 |
| 2024-01-02 | 4742.83 |
| 2024-01-03 | 4704.81 |
| 2024-01-04 | 4688.68 |
| 2024-01-05 | 4697.24 |
If you are unable to retrive the data from the request, you can find the data in the marketdata.csv file.
- Create the two parameters,
and . Together with the original price series the data should look as follows. (2p)
| Date | Price | ma-10 | ma-50 |
|---|---|---|---|
| 2023-12-29 | 4769.83 | 4753.74 | 4502.62 |
| 2024-01-02 | 4742.83 | 4756.1 | 4511.92 |
| 2024-01-03 | 4704.81 | 4752.53 | 4521.53 |
| 2024-01-04 | 4688.68 | 4744.56 | 4530.97 |
| 2024-01-05 | 4697.24 | 4744.45 | 4539.96 |
Note that the first entries are missing. Reason being that there are not enough preceding values to calculate the averages. You can drop the rows of these missing values.
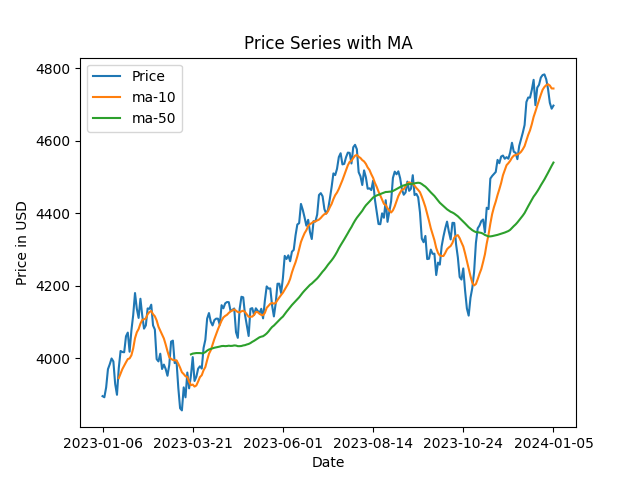
- Visualise the three series. That is, generate the following line plot (1p)

From this plot, you can interpret having a buy(long) position when the orange(short) line is above the green(long) line. That is, the difference is positive. And vice-versa for a sell(short) position. The position we want is called signal
- Calculate the signal
. (1p)
To evaluate the return of the strategy, we need to calculate the daily return of the strategy and finally aggregate the total daily return.
The daily return of the price series is
and the strategy return is
The reason, we use
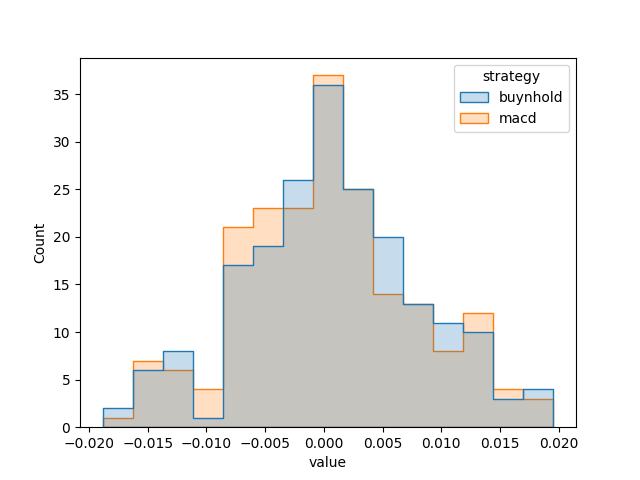
- Calculate the strategy return series and compare the return distribution of our strategy compared to the simple strategy of buying and holding (
for all ). That is generate the following plot.(2p)

- Determine which strategy is better and why. Explain your reasoning.(3p)
Do not use this as an investment strategy without further research!